class: center, middle, inverse, title-slide .title[ # Tools for easy data visualization and exploration ] .author[ ### Julia Romanowska ] .institute[ ### BIOS, IGS, UiB ] .date[ ### October 25, 2022 ] --- class: inverse, middle, left # Outline ## Data exploration ## Visualization basics ## Advanced plotting with {ggplot2} ??? Visualization of data - whether it's results of statistical analyses or just some exemplary data points - is so much more than just the actual figure. The tools for creating a visualization are the same, but the purpose might be very different: - we should create lots of visualizations when exploring the data - we will often plot analyses results - these might be easier to interact with than tables - we should _carefully design_ final plots, whether for a presentation or paper. During the workshop, we will talk about these different aspects of data visualization. I will also show examples of tools that one can use, both very simple and advanced. --- class: inverse, middle, center # <img src="figs/noun-telescope-white.png" tag="Telescope by anggun from NounProject.com" alt="Telescope icon by anggun from NounProject.com" style="height: 60px"> Data exploration ??? When we get new data in our hands, first thing we do is to explore. For that, summarizing data is very useful, but sometimes we need also to visualize data to be able to understand it or look at outliers. But most importantly, we need to check whether the data is in correct format and contains logical variables. We call this usable data format... --- ## Tidy data ??? ... tidy data. At first, you might think that tidy data is the one where all the missing or unreliable datapoints are removed. But no! -- **is not:** - data with missing values removed - data with unreliable measurements removed - data that looks nice in Excel ??? So what is it? -- **is:** OBSERVATIONS = ROWS VARIABLES = COLUMNS ??? This is a format of data where each observation is in a row and each variable is in a column. Let's look at some examples. --- ## Tidy data **Examples** | | treatmenta | treatmentb | |:------------|:-----------:|:-----------:| | John Smith | --- | 2 | | Jane Doe | 16 | 11 | | Mary Johnson | 3 | 1 | <div style="text-align: center; margin-bottom: 20px; margin-top: 20px;"> <span style="font-style: italic;">Table 1:</span> Typical presentation dataset. </div> | | John Smith | Jane Doe | Mary Johnson | |:------------|:-----------:|:-----------:|:-------------:| | treatmenta | - | 16 | 3 | | treatmentb | 2 | 11 | 1 | <div style="text-align: center; margin-bottom: 20px; margin-top: 20px;"> <span style="font-style: italic;">Table 2:</span> The same data as in Table 1 but structured differently. </div> <p style="font-size: small; font-style: italic; position: absolute; bottom: 40px;"> src: Wickham, H. (2014). Tidy data. Journal of Statistical Software, 59(10). </p> ??? Why these datasets are not tidy? The values under `treatmenta` and `treatmentb` are measuring the same thing, but perhaps at a different time, so these are not two variables. What would happen if we started analysing this and suddenly, we will get more data where there are now treatments a, b, and c? We would have to re-write the analysis scripts because we have had only a and b until now. In Table 2 - how do we approach analysis here? We have (potentially) very many columns with persons - should we analyse each separately by hand? --- ## Tidy data **Examples - ctd** | person | treatment | result | |:--------|:---------:|:------:| | John Smith | a | — | | Jane Doe | a | 16 | | Mary Johnson | a | 3 | | John Smith | b | 2 | | Jane Doe | b | 11 | | Mary Johnson | b | 1 | <div style="text-align: center; margin-bottom: 20px; margin-top: 20px;"> <span style="font-style: italic;">Table 3:</span> The same data as in Table 1 but with variables in columns and observations in rows. </div> ??? With tidy data, we can create a script that gathers all the treatment per person and e.g., compares the results. This script will be unchanged if there come more persons to our study or if the treatment changes. --- ## Tidy data <img src="figs/tidydata_2.jpg" style="width: 80%;"> --- ## Tidy data <img src="figs/tidydata_5.jpg" style="width: 80%;"> ??? If data is tidy, it's easier to automate the exploration and analysis. --- ## Automatic summary - depends on the data type _(character, factor, numeric, date/time)_ - duplicated measurements - missing data - correlated variables --- ## Automatic summary - tools: - `{skimr}` *basic summary of each variable,* - `{DataExplorer}` *automatic data exploration, with plots, correlations between variables, etc.* - `{dataReporter}` *automatic report, detailed, focus on potential problems in data* --- class: inverse, center, middle # <svg aria-hidden="true" role="img" viewBox="0 0 640 512" style="height:1em;width:1.25em;vertical-align:-0.125em;margin-left:auto;margin-right:auto;font-size:inherit;fill:currentColor;overflow:visible;position:relative;"><path d="M128 96h384v256h64V80C576 53.63 554.4 32 528 32h-416C85.63 32 64 53.63 64 80V352h64V96zM624 384h-608C7.25 384 0 391.3 0 400V416c0 35.25 28.75 64 64 64h512c35.25 0 64-28.75 64-64v-16C640 391.3 632.8 384 624 384zM365.9 286.2C369.8 290.1 374.9 292 380 292s10.23-1.938 14.14-5.844l48-48c7.812-7.813 7.812-20.5 0-28.31l-48-48c-7.812-7.813-20.47-7.813-28.28 0c-7.812 7.813-7.812 20.5 0 28.31l33.86 33.84l-33.86 33.84C358 265.7 358 278.4 365.9 286.2zM274.1 161.9c-7.812-7.813-20.47-7.813-28.28 0l-48 48c-7.812 7.813-7.812 20.5 0 28.31l48 48C249.8 290.1 254.9 292 260 292s10.23-1.938 14.14-5.844c7.812-7.813 7.812-20.5 0-28.31L240.3 224l33.86-33.84C281.1 182.4 281.1 169.7 274.1 161.9z"/></svg> DEMO --- class: inverse, middle, center # <svg aria-hidden="true" role="img" viewBox="0 0 512 512" style="height:1em;width:1em;vertical-align:-0.125em;margin-left:auto;margin-right:auto;font-size:inherit;fill:currentColor;overflow:visible;position:relative;"><path d="M0 32C0 14.33 14.33 0 32 0H160C177.7 0 192 14.33 192 32V416C192 469 149 512 96 512C42.98 512 0 469 0 416V32zM128 64H64V128H128V64zM64 256H128V192H64V256zM96 440C109.3 440 120 429.3 120 416C120 402.7 109.3 392 96 392C82.75 392 72 402.7 72 416C72 429.3 82.75 440 96 440zM224 416V154L299.4 78.63C311.9 66.13 332.2 66.13 344.7 78.63L435.2 169.1C447.7 181.6 447.7 201.9 435.2 214.4L223.6 425.9C223.9 422.7 224 419.3 224 416V416zM374.8 320H480C497.7 320 512 334.3 512 352V480C512 497.7 497.7 512 480 512H182.8L374.8 320z"/></svg> DataViz design --- # Warmup <div class="countdown" id="timer_5b94bb85" data-warn-when="15" data-update-every="1" data-play-sound="true" tabindex="0" style="top:0;right:0;"> <div class="countdown-controls"><button class="countdown-bump-down">−</button><button class="countdown-bump-up">+</button></div> <code class="countdown-time"><span class="countdown-digits minutes">03</span><span class="countdown-digits colon">:</span><span class="countdown-digits seconds">00</span></code> </div> > Grab a piece of paper and a pencil and draw this data! |DATE | CAPACITY| DEMAND| |:-------|--------:|------:| |2019-04 | 29263| 46193| |2019-05 | 28037| 49131| |2019-06 | 21596| 50124| |2019-07 | 25895| 48850| |2019-08 | 25813| 47602| |2019-09 | 22427| 43697| |2019-10 | 23605| 41058| |2019-11 | 24263| 37364| |2019-12 | 24243| 34364| ??? Questions - was it easy to imagine the data? - how did you start drawing? - did you change your point of view of the data _after_ you've sketched it? - what questions arised when you saw the data plotted? --- ## Data viz _design_ ??? It's not enough to _show_ your data - you need to carefuly pick the datapoints you want to focus on, think about the fonts, the axes, the orientation of the plot, the colors(!), and title/captions. All this process is called _designing_ your visual. And as with any other design or planning, it all starts with... -- - <svg aria-hidden="true" role="img" viewBox="0 0 512 512" style="height:1em;width:1em;vertical-align:-0.125em;margin-left:auto;margin-right:auto;font-size:inherit;fill:currentColor;overflow:visible;position:relative;"><path d="M421.7 220.3L188.5 453.4L154.6 419.5L158.1 416H112C103.2 416 96 408.8 96 400V353.9L92.51 357.4C87.78 362.2 84.31 368 82.42 374.4L59.44 452.6L137.6 429.6C143.1 427.7 149.8 424.2 154.6 419.5L188.5 453.4C178.1 463.8 165.2 471.5 151.1 475.6L30.77 511C22.35 513.5 13.24 511.2 7.03 504.1C.8198 498.8-1.502 489.7 .976 481.2L36.37 360.9C40.53 346.8 48.16 333.9 58.57 323.5L291.7 90.34L421.7 220.3zM492.7 58.75C517.7 83.74 517.7 124.3 492.7 149.3L444.3 197.7L314.3 67.72L362.7 19.32C387.7-5.678 428.3-5.678 453.3 19.32L492.7 58.75z"/></svg> pen & <svg aria-hidden="true" role="img" viewBox="0 0 448 512" style="height:1em;width:0.88em;vertical-align:-0.125em;margin-left:auto;margin-right:auto;font-size:inherit;fill:currentColor;overflow:visible;position:relative;"><path d="M400 32h-352C21.49 32 0 53.49 0 80v352C0 458.5 21.49 480 48 480h245.5c16.97 0 33.25-6.744 45.26-18.75l90.51-90.51C441.3 358.7 448 342.5 448 325.5V80C448 53.49 426.5 32 400 32zM64 96h320l-.001 224H320c-17.67 0-32 14.33-32 32v64H64V96z"/></svg> paper ??? When you grab a blank sheet of paper, you're getting free of all the limitations that a tool of your choice can give you. And of the frustrations as well, if you're only beginning to learn the tool! With a pen and paper, you may focus on what's important for the presentation of the data... -- - <svg aria-hidden="true" role="img" viewBox="0 0 512 512" style="height:1em;width:1em;vertical-align:-0.125em;margin-left:auto;margin-right:auto;font-size:inherit;fill:currentColor;overflow:visible;position:relative;"><path d="M256 0C114.6 0 0 114.6 0 256s114.6 256 256 256s256-114.6 256-256S397.4 0 256 0zM256 400c-18 0-32-14-32-32s13.1-32 32-32c17.1 0 32 14 32 32S273.1 400 256 400zM325.1 258L280 286V288c0 13-11 24-24 24S232 301 232 288V272c0-8 4-16 12-21l57-34C308 213 312 206 312 198C312 186 301.1 176 289.1 176h-51.1C225.1 176 216 186 216 198c0 13-11 24-24 24s-24-11-24-24C168 159 199 128 237.1 128h51.1C329 128 360 159 360 198C360 222 347 245 325.1 258z"/></svg> what the data tells me? ??? Normally, we would plot data when we want to explore some variables or when we have results of an analysis. One thing is known: we don't know how the data look like. We may know how it _should_ look like, though. That's why we may start designing with one type of plot in mind, but in the end the plot might look completely different! That's why it's important to draw by hand some sketches and think about the question here. When we finally have plotted something and understood the message behind the data, we need to improve the visual. -- name: declutter - **declutter** + **explain** - _([example](#plot_examples))_ ??? - do we really need all the points? - what about the axis ticks? and axis labels? - can we include a take-home message in title/caption? - is the legend in right place? - have we used **color** wisely? (I will talk about the colors next) -- <br> > Who's my target audience? ??? This entire process needs to be repeated when we present our plot for different groups of people! This process is very important and one could talk about this for hours. I've just mentioned important points, and gathered some references for you to read if you're interested. --- ## Plot type Plethora of plot types! - good short info about most used types: https://www.storytellingwithdata.com/chart-guide - all, including more exotic types: https://datavizproject.com/ -- Different type, based on: - continuous vs. categorical data - all points vs. averaged/smoothed - categories, time series, etc. -- name: plot_types Some tips: - [lasagne plot](#spaghetti) _if you really need to plot **all** the data points_ - [circles and bars](#area) _size matters!_ ??? But the most important tip you get from me on choosing the plot type is... --- class: inverse, right, middle ## <svg aria-hidden="true" role="img" viewBox="0 0 448 512" style="height:1em;width:0.88em;vertical-align:-0.125em;margin-left:auto;margin-right:auto;font-size:inherit;fill:currentColor;overflow:visible;position:relative;"><path d="M368 128C368 172.4 342.6 211.5 304 234.4V256C304 273.7 289.7 288 272 288H175.1C158.3 288 143.1 273.7 143.1 256V234.4C105.4 211.5 79.1 172.4 79.1 128C79.1 57.31 144.5 0 223.1 0C303.5 0 368 57.31 368 128V128zM167.1 176C185.7 176 199.1 161.7 199.1 144C199.1 126.3 185.7 112 167.1 112C150.3 112 135.1 126.3 135.1 144C135.1 161.7 150.3 176 167.1 176zM280 112C262.3 112 248 126.3 248 144C248 161.7 262.3 176 280 176C297.7 176 312 161.7 312 144C312 126.3 297.7 112 280 112zM3.378 273.7C11.28 257.9 30.5 251.5 46.31 259.4L223.1 348.2L401.7 259.4C417.5 251.5 436.7 257.9 444.6 273.7C452.5 289.5 446.1 308.7 430.3 316.6L295.6 384L430.3 451.4C446.1 459.3 452.5 478.5 444.6 494.3C436.7 510.1 417.5 516.5 401.7 508.6L223.1 419.8L46.31 508.6C30.5 516.5 11.28 510.1 3.378 494.3C-4.526 478.5 1.881 459.3 17.69 451.4L152.4 384L17.69 316.6C1.881 308.7-4.526 289.5 3.378 273.7V273.7z"/></svg> DON'T USE PIE CHART! <svg aria-hidden="true" role="img" viewBox="0 0 448 512" style="height:1em;width:0.88em;vertical-align:-0.125em;margin-left:auto;margin-right:auto;font-size:inherit;fill:currentColor;overflow:visible;position:relative;"><path d="M368 128C368 172.4 342.6 211.5 304 234.4V256C304 273.7 289.7 288 272 288H175.1C158.3 288 143.1 273.7 143.1 256V234.4C105.4 211.5 79.1 172.4 79.1 128C79.1 57.31 144.5 0 223.1 0C303.5 0 368 57.31 368 128V128zM167.1 176C185.7 176 199.1 161.7 199.1 144C199.1 126.3 185.7 112 167.1 112C150.3 112 135.1 126.3 135.1 144C135.1 161.7 150.3 176 167.1 176zM280 112C262.3 112 248 126.3 248 144C248 161.7 262.3 176 280 176C297.7 176 312 161.7 312 144C312 126.3 297.7 112 280 112zM3.378 273.7C11.28 257.9 30.5 251.5 46.31 259.4L223.1 348.2L401.7 259.4C417.5 251.5 436.7 257.9 444.6 273.7C452.5 289.5 446.1 308.7 430.3 316.6L295.6 384L430.3 451.4C446.1 459.3 452.5 478.5 444.6 494.3C436.7 510.1 417.5 516.5 401.7 508.6L223.1 419.8L46.31 508.6C30.5 516.5 11.28 510.1 3.378 494.3C-4.526 478.5 1.881 459.3 17.69 451.4L152.4 384L17.69 316.6C1.881 308.7-4.526 289.5 3.378 273.7V273.7z"/></svg> ### too high ink:information ratio ### area is difficult to grasp ### bars or points are _much better!_ ??? Pie chart is OK when showing two-three categories - this requires then much "ink" and gives relatively little information. Although nowadays, nobody cares much about "ink", the low ink:information ratio is still considered as one of the markers of good quality in visual design. Human eye is not able to assess correctly small changes in area! Bars or points are much easier to create and much easier to read! --- class: inverse, right, middle # <svg aria-hidden="true" role="img" viewBox="0 0 448 512" style="height:1em;width:0.88em;vertical-align:-0.125em;margin-left:auto;margin-right:auto;font-size:inherit;fill:currentColor;overflow:visible;position:relative;"><path d="M368 128C368 172.4 342.6 211.5 304 234.4V256C304 273.7 289.7 288 272 288H175.1C158.3 288 143.1 273.7 143.1 256V234.4C105.4 211.5 79.1 172.4 79.1 128C79.1 57.31 144.5 0 223.1 0C303.5 0 368 57.31 368 128V128zM167.1 176C185.7 176 199.1 161.7 199.1 144C199.1 126.3 185.7 112 167.1 112C150.3 112 135.1 126.3 135.1 144C135.1 161.7 150.3 176 167.1 176zM280 112C262.3 112 248 126.3 248 144C248 161.7 262.3 176 280 176C297.7 176 312 161.7 312 144C312 126.3 297.7 112 280 112zM3.378 273.7C11.28 257.9 30.5 251.5 46.31 259.4L223.1 348.2L401.7 259.4C417.5 251.5 436.7 257.9 444.6 273.7C452.5 289.5 446.1 308.7 430.3 316.6L295.6 384L430.3 451.4C446.1 459.3 452.5 478.5 444.6 494.3C436.7 510.1 417.5 516.5 401.7 508.6L223.1 419.8L46.31 508.6C30.5 516.5 11.28 510.1 3.378 494.3C-4.526 478.5 1.881 459.3 17.69 451.4L152.4 384L17.69 316.6C1.881 308.7-4.526 289.5 3.378 273.7V273.7z"/></svg> DON'T EVER USE 3D! <svg aria-hidden="true" role="img" viewBox="0 0 448 512" style="height:1em;width:0.88em;vertical-align:-0.125em;margin-left:auto;margin-right:auto;font-size:inherit;fill:currentColor;overflow:visible;position:relative;"><path d="M368 128C368 172.4 342.6 211.5 304 234.4V256C304 273.7 289.7 288 272 288H175.1C158.3 288 143.1 273.7 143.1 256V234.4C105.4 211.5 79.1 172.4 79.1 128C79.1 57.31 144.5 0 223.1 0C303.5 0 368 57.31 368 128V128zM167.1 176C185.7 176 199.1 161.7 199.1 144C199.1 126.3 185.7 112 167.1 112C150.3 112 135.1 126.3 135.1 144C135.1 161.7 150.3 176 167.1 176zM280 112C262.3 112 248 126.3 248 144C248 161.7 262.3 176 280 176C297.7 176 312 161.7 312 144C312 126.3 297.7 112 280 112zM3.378 273.7C11.28 257.9 30.5 251.5 46.31 259.4L223.1 348.2L401.7 259.4C417.5 251.5 436.7 257.9 444.6 273.7C452.5 289.5 446.1 308.7 430.3 316.6L295.6 384L430.3 451.4C446.1 459.3 452.5 478.5 444.6 494.3C436.7 510.1 417.5 516.5 401.7 508.6L223.1 419.8L46.31 508.6C30.5 516.5 11.28 510.1 3.378 494.3C-4.526 478.5 1.881 459.3 17.69 451.4L152.4 384L17.69 316.6C1.881 308.7-4.526 289.5 3.378 273.7V273.7z"/></svg> --- ## Choosing medium and audience - popular science *vs.* scientific article - manuscript *vs.* presentation - font size, level of details <img src="figs/selcuk_corruption.png" style="width:30%;"> <img src="figs/economist_graph.png" style="width:45%;"> src: *Akcay, S. (2006). Corruption and human development. Cato Journal 26(1), 29-48*; https://www.economist.com/graphic-detail/2011/12/02/corrosive-corruption --- ## Choosing medium and audience - popular science *vs.* scientific article - manuscript *vs.* presentation - font size, level of details <img src="figs/Rougier_PLoSCompBiol2014_fig3.png" style="width: 70%;"> src: Rougier et al. PLoS Comput. Biol. 10, e1003833 (2014) --- ## Choosing color - **accessibility!** - good tool for choosing palette: [ColorBrewer](https://colorbrewer2.org/) by Cynthia Brewer - recommended paper: [Crameri, F., Shephard, G. E., & Heron, P. J. *(2020)*. The misuse of colour in science communication. *Nature Communications*, 11(1), 1–10.](https://www.nature.com/articles/s41467-020-19160-7) > <svg aria-hidden="true" role="img" viewBox="0 0 512 512" style="height:1em;width:1em;vertical-align:-0.125em;margin-left:auto;margin-right:auto;font-size:inherit;fill:currentColor;overflow:visible;position:relative;"><path d="M506.3 417l-213.3-364c-16.33-28-57.54-28-73.98 0l-213.2 364C-10.59 444.9 9.849 480 42.74 480h426.6C502.1 480 522.6 445 506.3 417zM232 168c0-13.25 10.75-24 24-24S280 154.8 280 168v128c0 13.25-10.75 24-23.1 24S232 309.3 232 296V168zM256 416c-17.36 0-31.44-14.08-31.44-31.44c0-17.36 14.07-31.44 31.44-31.44s31.44 14.08 31.44 31.44C287.4 401.9 273.4 416 256 416z"/></svg> wrong color palette can _distort_ the data and > _change_ the meaning of your visual ??? Colors are important - they create meaning, grab viewer's attention, show differences or similarities, and when used wrongly can distort the information. We want to choose the colors _wisely_, so that everyone can get the information we wanted to show with ease. **Everyone** = we need to consider those who have problems with seeing all colors or problems with seeing at all. **With ease** = watch out for colors that are associated with a specific meaning. What to consider when choosing colors: - are there colors that _naturally_ come to mind when thinking about the information we want to display? (e.g., hot-cold areas, bad-good treatments, seasonal change in measurements) - check here: https://informationisbeautiful.net/visualizations/colours-in-cultures/ - blog post: https://www.storytellingwithdata.com/blog/2021/6/8/colors-and-emotions-in-data-visualization - do I need colors or is it enough with gray-shades? - is the color scale continuous or categorical? - _in case of continuous color scale:_ is it the best way to present a change or would it be enough to show, e.g., size or bars along a timeline? - _when dealing with very many categories:_ can a handfull of them be colored, leaving the rest in gray, for contrast? --- class: inverse, left, bottom ## SUMMARY ### know your data ??? So what we've learned til now: - spend time on exploring the data and check what the data tells you -- ### know your audience ??? - when critiquing the plot, have in mind who will look at it and under what circumstances! - you can't show the same plot in a scientific journal article, and during a presentation for students! -- ### _design_ your visual ??? - use time to design the visual - don't just show all the data you have, but choose carefully what to show and how so that the message is clear --- ## <svg aria-hidden="true" role="img" viewBox="0 0 512 512" style="height:1em;width:1em;vertical-align:-0.125em;margin-left:auto;margin-right:auto;font-size:inherit;fill:currentColor;overflow:visible;position:relative;"><path d="M200 376l-49.23-16.41c-7.289-2.434-7.289-12.75 0-15.18L200 328l16.41-49.23c2.434-7.289 12.75-7.289 15.18 0L248 328l49.23 16.41c7.289 2.434 7.289 12.75 0 15.18L248 376L240 416H448l-86.38-201.6C355.4 200 354.8 183.8 359.8 168.9L416 0L228.4 107.3C204.8 120.8 185.1 141.4 175 166.4L64 416h144L200 376zM231.2 172.4L256 160l12.42-24.84c1.477-2.949 5.68-2.949 7.156 0L288 160l24.84 12.42c2.949 1.477 2.949 5.68 0 7.156L288 192l-12.42 24.84c-1.477 2.949-5.68 2.949-7.156 0L256 192L231.2 179.6C228.2 178.1 228.2 173.9 231.2 172.4zM496 448h-480C7.164 448 0 455.2 0 464C0 490.5 21.49 512 48 512h416c26.51 0 48-21.49 48-48C512 455.2 504.8 448 496 448z"/></svg> Automatic plotting - [{esquisse} package](https://dreamrs.github.io/esquisse/index.html) - [{finalfit} package](https://finalfit.org/articles/finalfit.html) - _many others, depending on analysis type_ --- class: inverse, center, middle # <svg aria-hidden="true" role="img" viewBox="0 0 640 512" style="height:1em;width:1.25em;vertical-align:-0.125em;margin-left:auto;margin-right:auto;font-size:inherit;fill:currentColor;overflow:visible;position:relative;"><path d="M128 96h384v256h64V80C576 53.63 554.4 32 528 32h-416C85.63 32 64 53.63 64 80V352h64V96zM624 384h-608C7.25 384 0 391.3 0 400V416c0 35.25 28.75 64 64 64h512c35.25 0 64-28.75 64-64v-16C640 391.3 632.8 384 624 384zM365.9 286.2C369.8 290.1 374.9 292 380 292s10.23-1.938 14.14-5.844l48-48c7.812-7.813 7.812-20.5 0-28.31l-48-48c-7.812-7.813-20.47-7.813-28.28 0c-7.812 7.813-7.812 20.5 0 28.31l33.86 33.84l-33.86 33.84C358 265.7 358 278.4 365.9 286.2zM274.1 161.9c-7.812-7.813-20.47-7.813-28.28 0l-48 48c-7.812 7.813-7.812 20.5 0 28.31l48 48C249.8 290.1 254.9 292 260 292s10.23-1.938 14.14-5.844c7.812-7.813 7.812-20.5 0-28.31L240.3 224l33.86-33.84C281.1 182.4 281.1 169.7 274.1 161.9z"/></svg> DEMO --- class: inverse, right, middle ## <svg aria-hidden="true" role="img" viewBox="0 0 576 512" style="height:1em;width:1.12em;vertical-align:-0.125em;margin-left:auto;margin-right:auto;font-size:inherit;fill:currentColor;overflow:visible;position:relative;"><path d="M224 263.3C224.2 233.3 238.4 205.2 262.4 187.2L499.1 9.605C517.7-4.353 543.6-2.965 560.7 12.9C577.7 28.76 580.8 54.54 568.2 74.07L406.5 324.1C391.3 347.7 366.6 363.2 339.3 367.1L224 263.3zM320 400C320 461.9 269.9 512 208 512H64C46.33 512 32 497.7 32 480C32 462.3 46.33 448 64 448H68.81C86.44 448 98.4 429.1 96.59 411.6C96.2 407.8 96 403.9 96 400C96 339.6 143.9 290.3 203.7 288.1L319.8 392.5C319.9 394.1 320 397.5 320 400V400z"/></svg> Not automatic plotting with {ggplot2} --- ### A plot in {ggplot2} consists of several layers: -- 1. data 2. aesthetics (`aes`) ([original documentation](https://ggplot2.tidyverse.org/reference/index.html#section-aesthetics)) 3. `geom`s ([original documentation](https://ggplot2.tidyverse.org/reference/index.html#section-geoms)) 4. `scale`s ([original documentation](https://ggplot2.tidyverse.org/reference/index.html#section-scales)) 5. `theme` ([original documentation](https://ggplot2.tidyverse.org/reference/index.html#section-themes)) ??? 1. data - strict format: tidy data! - one row per datapoint - all grouping must be included in the data 2. aesthetics (`aes`) ([original documentation](https://ggplot2.tidyverse.org/reference/index.html#section-aesthetics)) - how to map the data to the graph? - which column is *x*, *y*, ... - which column provides grouping (based on the grouping, one can either connect points into lines, split a graph into several facets, or color differently each group) 3. `geom`s ([original documentation](https://ggplot2.tidyverse.org/reference/index.html#section-geoms)) - how to visualize the data? - points (`geom_point`), lines (`geom_line`), bars (`geom_bar`), etc. - `geom`s are connected to `stat`s that conduct any necessary pre-processing of data (e.g., `geom_histogram` would first calculate the number of observations in each bin through `stat_bin`) 4. `scale`s ([original documentation](https://ggplot2.tidyverse.org/reference/index.html#section-scales)) - any type of data representation on the plot - coordinates: `scale_x_continuous`, `scale_x_discrete`, `scale_x_date`, etc. - colors: `scale_color_manual`, `scale_colour_brewer`, `scale_fill_continuous`, etc. 5. `theme` ([original documentation](https://ggplot2.tidyverse.org/reference/index.html#section-themes)) - visual aspects - size and types of fonts - positioning of axes, legends, etc. Each layer is added to the previous one with a `+` sign. The result can be saved to an object and added upon later. --- class: inverse, right, middle ## Example plot with {ggplot2} --- ## Data <div style="float: right; position: fixed; right: 10px; top: 10px;"> <img style="float: right; position: relative; width: 120px" src="figs/palmer_penguins_logo.png" alt="palmer penguins R package logo"/><br> </div> [palmerpenguins](https://allisonhorst.github.io/palmerpenguins/) <br><br><br> ``` # A tibble: 344 × 8 species island bill_length_mm bill_depth_mm flipper_length_mm body_mass_g <fct> <fct> <dbl> <dbl> <int> <int> 1 Adelie Torgersen 39.1 18.7 181 3750 2 Adelie Torgersen 39.5 17.4 186 3800 3 Adelie Torgersen 40.3 18 195 3250 4 Adelie Torgersen NA NA NA NA 5 Adelie Torgersen 36.7 19.3 193 3450 6 Adelie Torgersen 39.3 20.6 190 3650 7 Adelie Torgersen 38.9 17.8 181 3625 8 Adelie Torgersen 39.2 19.6 195 4675 9 Adelie Torgersen 34.1 18.1 193 3475 10 Adelie Torgersen 42 20.2 190 4250 # … with 334 more rows, and 2 more variables: sex <fct>, year <int> ``` ??? I will be using this simple dataset with morphological data of penguins living on a certain island. -- > **IMPORTANT** start with tidy data! **each row is an observation, each column is a variable** --- count: false .panel1-penguins_species_simple-auto[ ```r *ggplot(data = penguins) ``` ] .panel2-penguins_species_simple-auto[ <!-- --> ] --- count: false .panel1-penguins_species_simple-auto[ ```r ggplot(data = penguins) + * aes( * x = bill_length_mm, * y = bill_depth_mm * ) ``` ] .panel2-penguins_species_simple-auto[ <!-- --> ] --- count: false .panel1-penguins_species_simple-auto[ ```r ggplot(data = penguins) + aes( x = bill_length_mm, y = bill_depth_mm ) + * geom_point() ``` ] .panel2-penguins_species_simple-auto[ 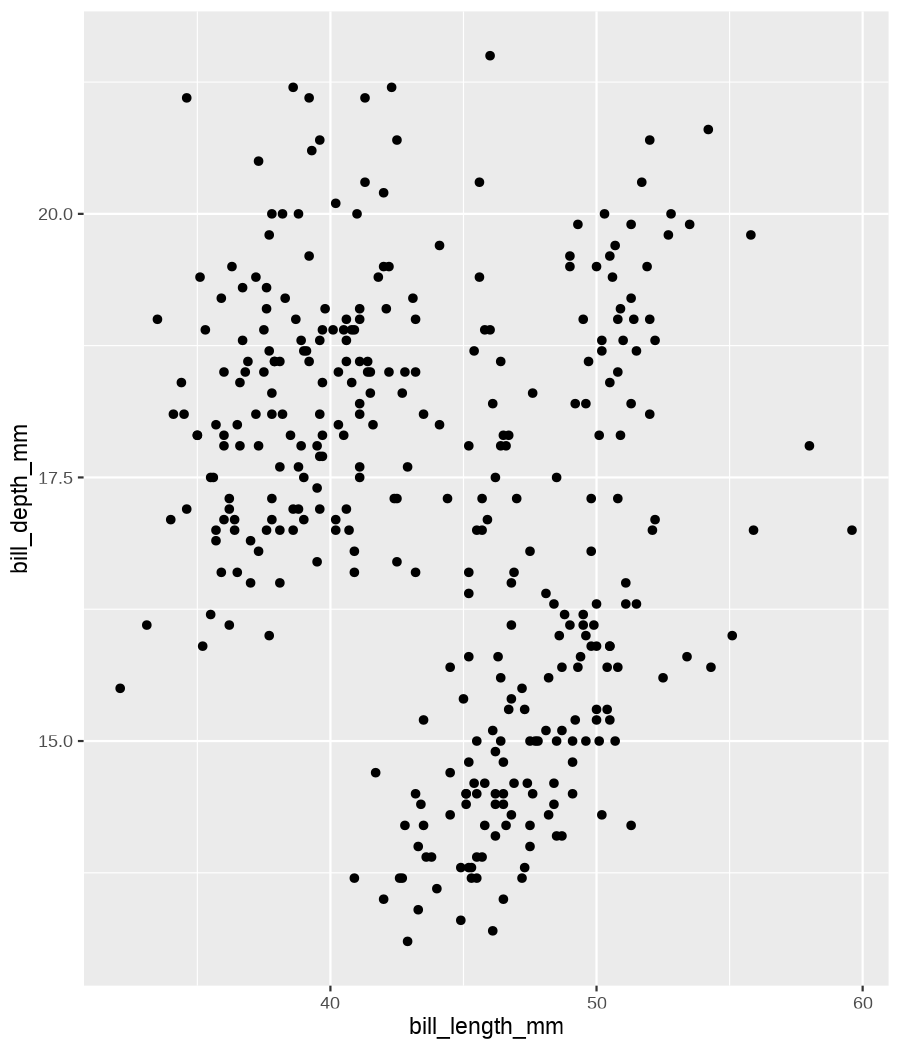<!-- --> ] --- count: false .panel1-penguins_species_simple-auto[ ```r ggplot(data = penguins) + aes( x = bill_length_mm, y = bill_depth_mm ) + geom_point() + * geom_smooth(method = "lm") ``` ] .panel2-penguins_species_simple-auto[ 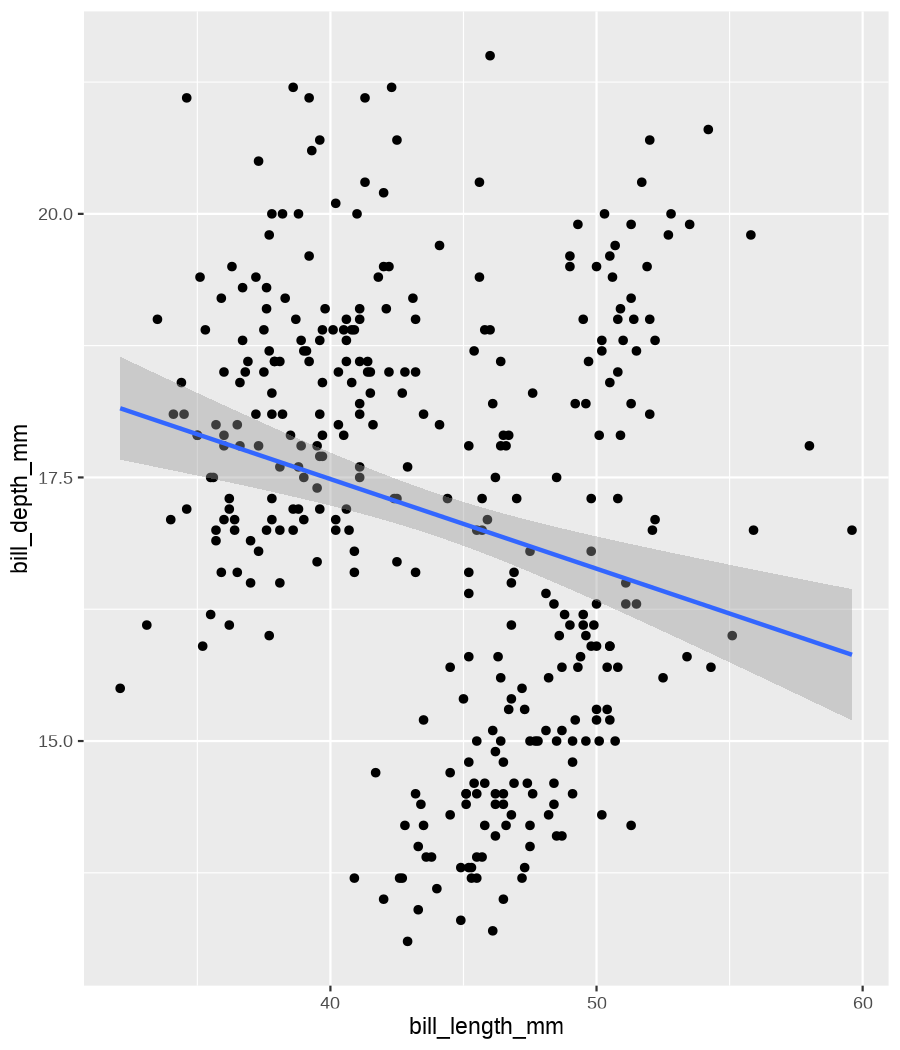<!-- --> ] <style> .panel1-penguins_species_simple-auto { color: black; width: 51.5789473684211%; hight: 32%; float: left; padding-left: 1%; font-size: 50% } .panel2-penguins_species_simple-auto { color: black; width: 46.421052631579%; hight: 32%; float: left; padding-left: 1%; font-size: 50% } .panel3-penguins_species_simple-auto { color: black; width: NA%; hight: 33%; float: left; padding-left: 1%; font-size: 50% } </style> --- count: false .panel1-penguins_species-auto[ ```r *ggplot(data = penguins) ``` ] .panel2-penguins_species-auto[ <!-- --> ] --- count: false .panel1-penguins_species-auto[ ```r ggplot(data = penguins) + * aes( * x = bill_length_mm, * y = bill_depth_mm * ) ``` ] .panel2-penguins_species-auto[ <!-- --> ] --- count: false .panel1-penguins_species-auto[ ```r ggplot(data = penguins) + aes( x = bill_length_mm, y = bill_depth_mm ) + * geom_point( * aes(color = species, * shape = species), * size = 2 * ) ``` ] .panel2-penguins_species-auto[ <!-- --> ] --- count: false .panel1-penguins_species-auto[ ```r ggplot(data = penguins) + aes( x = bill_length_mm, y = bill_depth_mm ) + geom_point( aes(color = species, shape = species), size = 2 ) + * geom_smooth( * method = "lm", * se = FALSE, * aes(color = species) * ) ``` ] .panel2-penguins_species-auto[ <!-- --> ] --- count: false .panel1-penguins_species-auto[ ```r ggplot(data = penguins) + aes( x = bill_length_mm, y = bill_depth_mm ) + geom_point( aes(color = species, shape = species), size = 2 ) + geom_smooth( method = "lm", se = FALSE, aes(color = species) ) *penguins_default <- last_plot() ``` ] .panel2-penguins_species-auto[ <!-- --> ] <style> .panel1-penguins_species-auto { color: black; width: 51.5789473684211%; hight: 32%; float: left; padding-left: 1%; font-size: 50% } .panel2-penguins_species-auto { color: black; width: 46.421052631579%; hight: 32%; float: left; padding-left: 1%; font-size: 50% } .panel3-penguins_species-auto { color: black; width: NA%; hight: 33%; float: left; padding-left: 1%; font-size: 50% } </style> ??? Basics of ggplot2: - layers - 'aesthetics' + data + geom --- count: false .panel1-penguins_species2-auto[ ```r *penguins_default ``` ] .panel2-penguins_species2-auto[ <!-- --> ] --- count: false .panel1-penguins_species2-auto[ ```r penguins_default + * scale_color_manual( * values = c("darkorange", * "darkorchid", * "cyan4") * ) ``` ] .panel2-penguins_species2-auto[ <!-- --> ] --- count: false .panel1-penguins_species2-auto[ ```r penguins_default + scale_color_manual( values = c("darkorange", "darkorchid", "cyan4") ) + * facet_grid(rows = vars(species)) ``` ] .panel2-penguins_species2-auto[ <!-- --> ] --- count: false .panel1-penguins_species2-auto[ ```r penguins_default + scale_color_manual( values = c("darkorange", "darkorchid", "cyan4") ) + facet_grid(rows = vars(species)) + * labs(title = * "Penguin species differentation") ``` ] .panel2-penguins_species2-auto[ <!-- --> ] --- count: false .panel1-penguins_species2-auto[ ```r penguins_default + scale_color_manual( values = c("darkorange", "darkorchid", "cyan4") ) + facet_grid(rows = vars(species)) + labs(title = "Penguin species differentation") + * labs(subtitle = * "based on bill depth and bill length") ``` ] .panel2-penguins_species2-auto[ <!-- --> ] --- count: false .panel1-penguins_species2-auto[ ```r penguins_default + scale_color_manual( values = c("darkorange", "darkorchid", "cyan4") ) + facet_grid(rows = vars(species)) + labs(title = "Penguin species differentation") + labs(subtitle = "based on bill depth and bill length") + * xlab("bill length (mm)") ``` ] .panel2-penguins_species2-auto[ 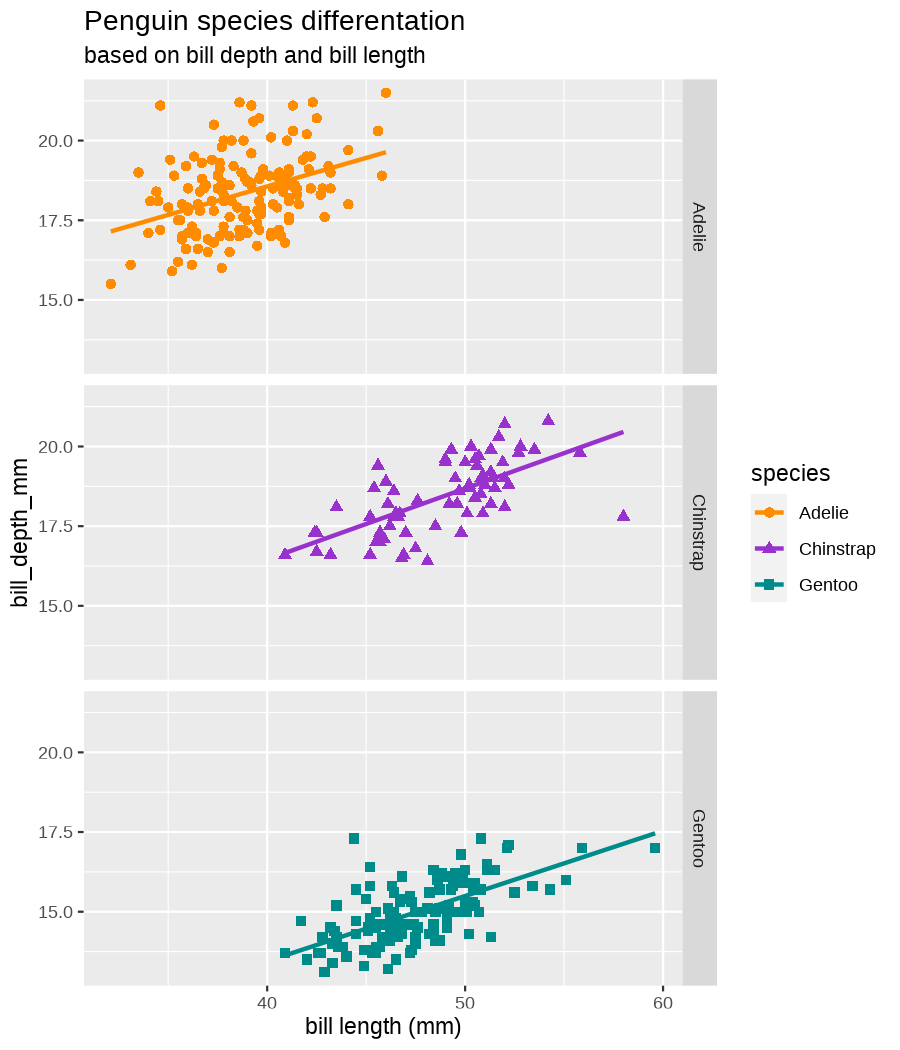<!-- --> ] --- count: false .panel1-penguins_species2-auto[ ```r penguins_default + scale_color_manual( values = c("darkorange", "darkorchid", "cyan4") ) + facet_grid(rows = vars(species)) + labs(title = "Penguin species differentation") + labs(subtitle = "based on bill depth and bill length") + xlab("bill length (mm)") + * ylab("bill depth (mm)") ``` ] .panel2-penguins_species2-auto[ 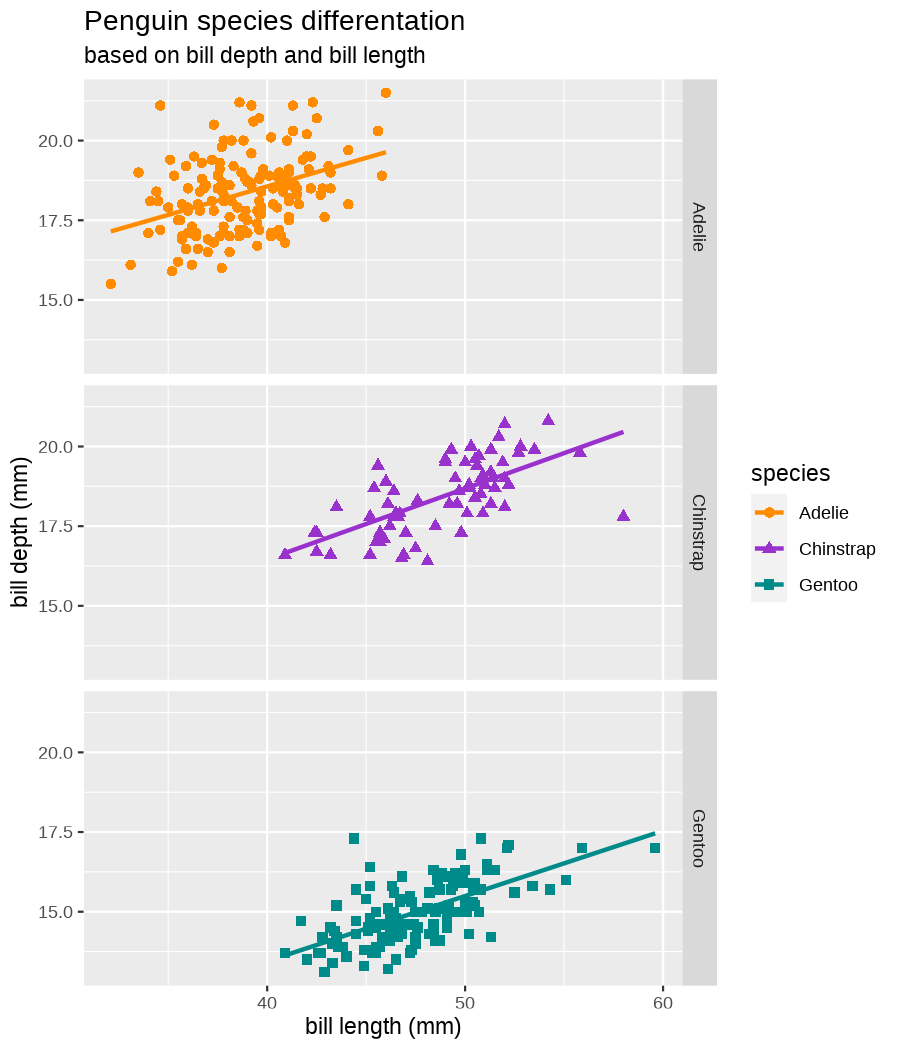<!-- --> ] --- count: false .panel1-penguins_species2-auto[ ```r penguins_default + scale_color_manual( values = c("darkorange", "darkorchid", "cyan4") ) + facet_grid(rows = vars(species)) + labs(title = "Penguin species differentation") + labs(subtitle = "based on bill depth and bill length") + xlab("bill length (mm)") + ylab("bill depth (mm)") + * theme_minimal() ``` ] .panel2-penguins_species2-auto[ 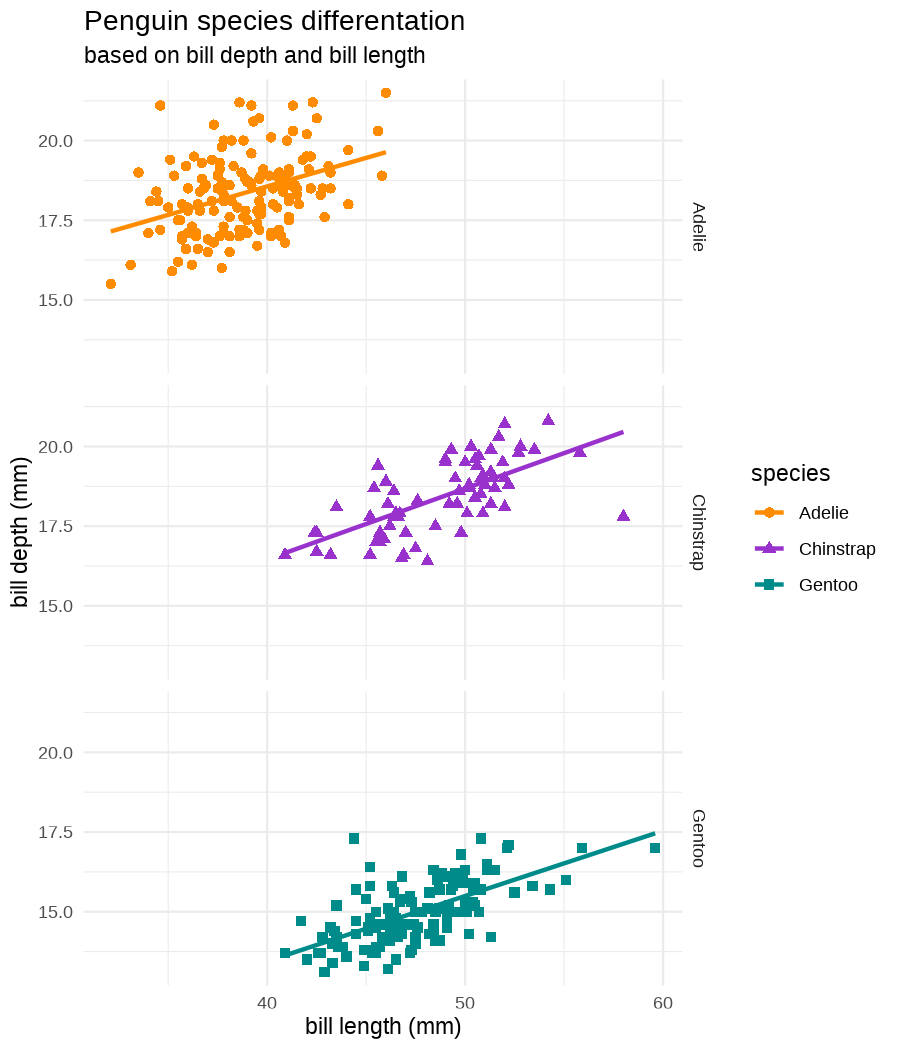<!-- --> ] --- count: false .panel1-penguins_species2-auto[ ```r penguins_default + scale_color_manual( values = c("darkorange", "darkorchid", "cyan4") ) + facet_grid(rows = vars(species)) + labs(title = "Penguin species differentation") + labs(subtitle = "based on bill depth and bill length") + xlab("bill length (mm)") + ylab("bill depth (mm)") + theme_minimal() + * theme( * plot.title = * element_text(face = "bold"), * plot.subtitle = * element_text(face = "italic")) ``` ] .panel2-penguins_species2-auto[ 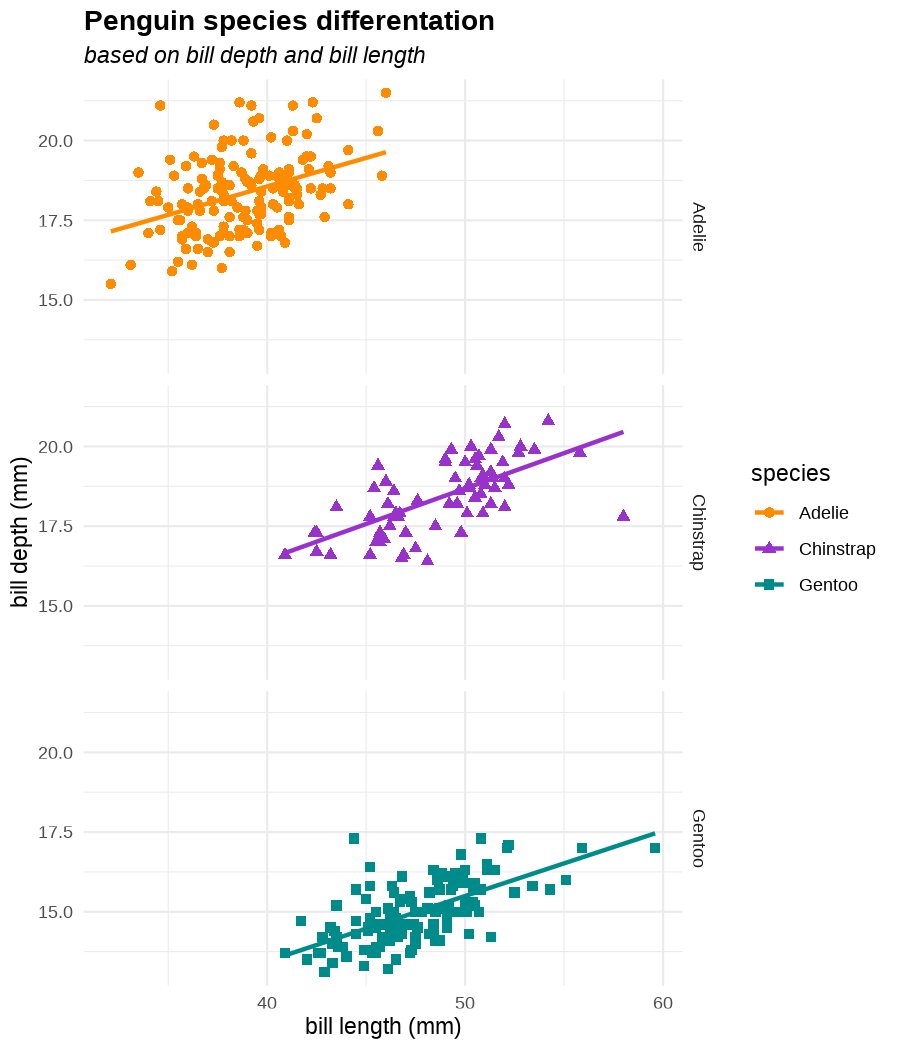<!-- --> ] --- count: false .panel1-penguins_species2-auto[ ```r penguins_default + scale_color_manual( values = c("darkorange", "darkorchid", "cyan4") ) + facet_grid(rows = vars(species)) + labs(title = "Penguin species differentation") + labs(subtitle = "based on bill depth and bill length") + xlab("bill length (mm)") + ylab("bill depth (mm)") + theme_minimal() + theme( plot.title = element_text(face = "bold"), plot.subtitle = element_text(face = "italic")) + * theme(legend.position = "none") ``` ] .panel2-penguins_species2-auto[ 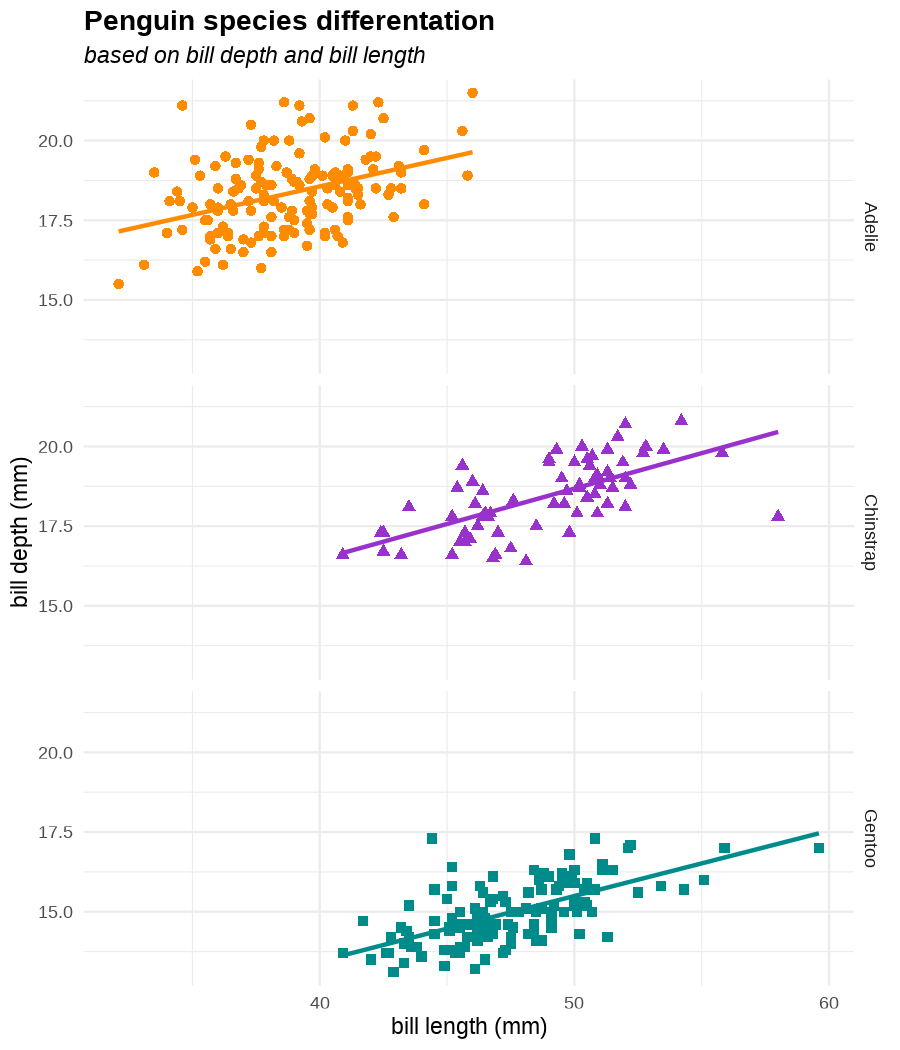<!-- --> ] <style> .panel1-penguins_species2-auto { color: black; width: 51.5789473684211%; hight: 32%; float: left; padding-left: 1%; font-size: 50% } .panel2-penguins_species2-auto { color: black; width: 46.421052631579%; hight: 32%; float: left; padding-left: 1%; font-size: 50% } .panel3-penguins_species2-auto { color: black; width: NA%; hight: 33%; float: left; padding-left: 1%; font-size: 50% } </style> ??? OK, that was the basic graph, but we can modify everything: - change of color, - split into sub-graphs, - adding graph title (and subtitle, caption) - adding axes titles - styling --- class: inverse, center, middle # <svg aria-hidden="true" role="img" viewBox="0 0 640 512" style="height:1em;width:1.25em;vertical-align:-0.125em;margin-left:auto;margin-right:auto;font-size:inherit;fill:currentColor;overflow:visible;position:relative;"><path d="M128 96h384v256h64V80C576 53.63 554.4 32 528 32h-416C85.63 32 64 53.63 64 80V352h64V96zM624 384h-608C7.25 384 0 391.3 0 400V416c0 35.25 28.75 64 64 64h512c35.25 0 64-28.75 64-64v-16C640 391.3 632.8 384 624 384zM365.9 286.2C369.8 290.1 374.9 292 380 292s10.23-1.938 14.14-5.844l48-48c7.812-7.813 7.812-20.5 0-28.31l-48-48c-7.812-7.813-20.47-7.813-28.28 0c-7.812 7.813-7.812 20.5 0 28.31l33.86 33.84l-33.86 33.84C358 265.7 358 278.4 365.9 286.2zM274.1 161.9c-7.812-7.813-20.47-7.813-28.28 0l-48 48c-7.812 7.813-7.812 20.5 0 28.31l48 48C249.8 290.1 254.9 292 260 292s10.23-1.938 14.14-5.844c7.812-7.813 7.812-20.5 0-28.31L240.3 224l33.86-33.84C281.1 182.4 281.1 169.7 274.1 161.9z"/></svg> DEMO --- name: plot_examples **Make a point!** <img src="figs/dataviz5.jpg" style="width: 45%;"> .footnote[src: Natalia Kiseleva, http://eolay.tilda.ws/en] --- **Make a point!** <img src="figs/dataviz4.jpg" style="width: 50%;"> .footnote[src: Natalia Kiseleva, http://eolay.tilda.ws/en] [back](#declutter) --- name: spaghetti ## Not spaghetti, but lasagne... <img src="figs/Duke_StatMed2014_fig2.png" style="width: 48%;"><img src="figs/Duke_StatMed2014_fig3.png" style="width: 45%;"> .footnote[src: Duke, S. P. et al. Stat.Med. 34 (2015) [back](#plot_types)] --- name: area ## Use disc area and bars starting from 0 <img src="figs/Rougier_PLoSCompBiol2014_fig6.png" style="width: 98%;"> .footnote[src: Rougier et al. PLoS Comput. Biol. 10, e1003833 (2014)] --- ## Don't clip the bars <img src="figs/dataviz7.png" style="width: 70%;"> src: Natalia Kiseleva, http://eolay.tilda.ws/en [back](#plot_types)